Liquidity Sweep Breakout - LSBLiquidity Sweep Breakout - LSB
A professional session-based breakout system designed for OANDA:USDJPY and other JPY pairs.
Not guesswork, but precision - built on detailed observation of institutional moves to capture clear trade direction daily.
Master the Market’s Daily Bank Flow.
---
Strategy Detail:
I discovered this strategy after carefully studying how Japanese banks influence the forex market during their daily settlement period. Banks are some of the biggest players in the financial world, and when they adjust or settle their accounts in the morning, it often creates a push in the market. From years of observation, I noticed a consistent pattern, once banks finish their settlements, the market usually continues moving in the same direction that was formed right after those actions. This daily banking flow often sets the tone for the entire trading session, especially for JPY pairs like USDJPY.
To capture this move, I built the indicator so that it follows the bank-driven trend with clear rules for entries, stop-loss (SL), and take-profit (TP). The system is designed with professional risk management in mind. By default, it assumes a $10,000 account size, risks only 1% of that balance per trade, and targets a 1:1.5 reward-to-risk ratio. This means for every $100 risked, the potential profit is $150. Such controlled risk makes the system safer and more sustainable for long-term traders. At the same time, users are not limited to this setup, they can adjust the account balance in the settings, and the indicator will automatically recalculate the lot size and risk levels based on their own capital. This ensures the strategy works for small accounts and larger accounts alike.
🌍 Why It Works
Fundamentally driven: Based on **daily Japanese banking settlement flows**.
Session-specific precision: Targets the exact window when USDJPY liquidity reshapes.
Risk-managed: Always calculates lot size based on account and risk preferences.
Automatable: With webhook + MT5 EA, it can be fully hands-free.
---
✅ Recommended
Pair: USDJPY (best observed behavior).
Timeframe: 3-Minute chart.
Platform: TradingView Premium (for webhooks).
Execution: MT5 via EA.
---
🔎 Strategy Concept
The Tokyo Magic Breakout (TMB) is built on years of session observation and the unique daily rhythm of the Japanese banking system.
Every morning between 5:50 AM – 6:10 AM PKT (09:50 – 10:10 JST), Japanese banks perform daily reconciliation and settlement. This often sets the tone for the USDJPY direction of the day.
This strategy isolates that critical moment of liquidity adjustment and waits for a clean breakout confirmation. Instead of chasing noise, it executes only when price action is aligned with the Tokyo market’s hidden flows.
---
🕒 Timing Logic
Session Start: 5:00 AM PKT (Tokyo market open range).
Magic Candle: The 5:54 AM PKT candle is marked as the reference “breakout selector.”
Checkpoints: First confirmation at 6:30 AM PKT, then every 15 minutes until 8:30 AM PKT.
* If price stays inside the magic range → wait.
* If a breakout happens but the candle wick touches the range → wait for the next checkpoint.
* If by 8:30 AM PKT no clean breakout occurs → the day is marked as No Trade Day (NTD).
👉 Recommended timeframe: 3-Minute chart (3M) for precise signals.
---
📈 Trade Execution
Entry: Clean break above/below the magic candle’s range.
Stop-Loss: Opposite side of the Tokyo session high/low.
Take-Profit: Calculated by Reward\:Risk ratio (default 1.5:1).
Lot Size: Auto-calculated based on your risk model:
* Fixed Dollar
* % of Equity
* Conservative (minimum of both).
Visuals include:
✅ Entry/SL/TP lines
✅ Shaded risk (red) and reward (green) zones
✅ Trade labels (Buy/Sell with lot size & levels)
✅ TP/SL hit markers
---
🔔 Alerts & Automation (AutoTMB)
This strategy is fully automation-ready with EA + MT5:
1. Enable alerts in TMB settings.
2. Insert your PineConnector License Key.
3. Configure your risk management preferences.
4. Create a TradingView alert → in the message box simply type:
Pine Script®
{{alert_message}}
and set the EA webhook.
Now, every breakout trade (with exact entry, SL, TP, and lot size) is sent instantly.
👉 On your MT5:
* Install the EA.
* Use the same license key.
* Run it on a VPS or local MT5 terminal.
You now have a hands-free trading system: AutoTMB.
"stop loss" için komut dosyalarını ara

Script_Algo - ORB Strategy with Filters🔍 Core Concept: This strategy combines three powerful technical analysis tools: Range Breakout, the SuperTrend indicator, and a volume filter. Additionally, it features precise customization of the number of candles used to construct the breakout range, enabling optimized performance for specific assets.
🎯 How It Works:
The strategy defines a trading range at the beginning of the trading session based on a selected number of candles.
It waits for a breakout above the upper or below the lower boundary of this range, requiring a candle close.
It filters signals using the SuperTrend indicator for trend confirmation.
It utilizes trading volume to filter out false breakouts.
⚡ Strategy Features
📈 Entry Points:
Long: Candle close above the upper range boundary + SuperTrend confirmation
Short: Candle close below the lower range boundary + SuperTrend confirmation
🛡️ Risk Management:
Stop-Loss: Set at the opposite range boundary.
Take-Profit: Calculated based on a risk/reward ratio (3:1 by default).
Position Size: 10 contracts (configurable).
⚠️ IMPORTANT SETTINGS
🕐 Time Parameters:
Set the correct time and time zone!
❕ATTENTION: The strategy works ONLY with correct time settings! Set the time corresponding to your location and trading session.
📊 This strategy is optimized for trading TESLA stock!
Parameters are tailored to TESLA's volatility, and trading volumes are adequate for signal filtering. Trading time corresponds to the American session.
📈 If you look at the backtesting results, you can see that the strategy could potentially have generated about 70 percent profit on Tesla stock over six months on 5m timeframe. However, this does not guarantee that results will be repeated in the future; remain vigilant.
⚠️ For other assets, the following is required:
Testing and parameter optimization
Adjustment of time intervals and the number of candles forming the range
Calibration of stop-loss and take-profit levels
⚠️ Limitations and Drawbacks
🔗 Automation Constraints:
❌ Cannot be directly connected via Webhook to CFD brokers!
Additional IT solutions are required for automation, thus only manual trading based on signals is possible.
📉 Risk Management:
Do not risk more than 2-3% of your account per trade.
Test on historical data before live use.
Start with a demo account.
💪 Strategy Advantages
✅ Combined approach – multiple signal filters
✅ Clear entry and exit rules
✅ Visual signals on the chart
✅ Volume-based false breakout filtering
✅ Automatic position management
🎯 Usage Recommendations
Always test the strategy on historical data.
Start with small trading volumes.
Ensure time settings are correct.
Adapt parameters to current market volatility.
Use only for stocks – futures and Forex require adaptation.
📚 Suitable Timeframes - M1-M15
Only highly liquid stocks
🍀 I wish all subscribers good luck in trading and steady profits!
📈 May your charts move in the right direction!
⚠️ Remember: Trading involves risk. Do not invest money you cannot afford to lose!

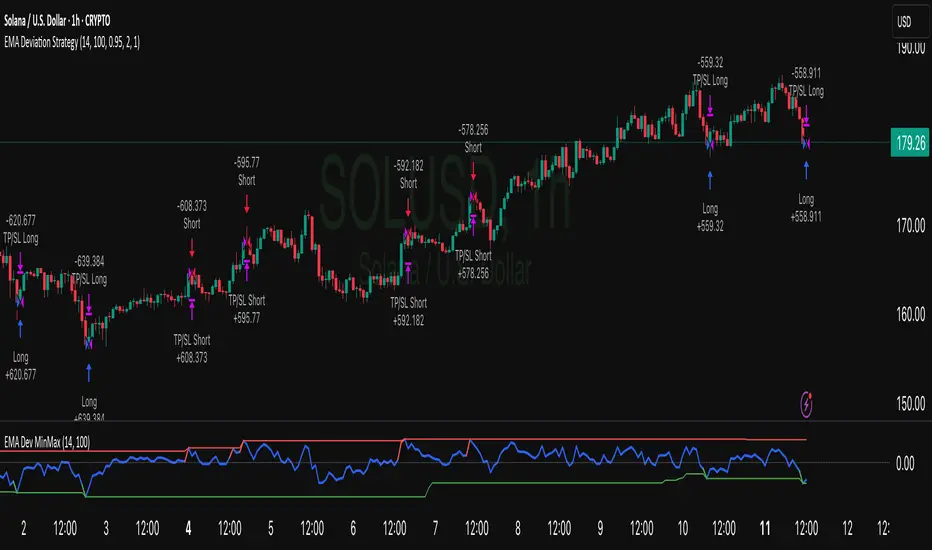
EMA Deviation Strategy📌 Strategy: EMA Deviation Strategy
The EMA Deviation Strategy identifies potential reversal points by measuring how far the current price deviates from its Exponential Moving Average (EMA). It dynamically tracks the minimum and maximum deviation levels over a user-defined lookback period, and enters trades when price reaches extreme zones.
🔍 Core Logic:
• Buy Entry: When price deviates significantly below the EMA, approaching the historical minimum deviation — signaling a potential rebound.
• Sell Entry: When price deviates significantly above the EMA, nearing the historical maximum deviation — signaling a possible pullback.
• Optional Take Profit / Stop Loss: Manage risk with customizable exit levels.
⚙️ Customizable Inputs:
• EMA length and lookback period
• Threshold sensitivity for entry signals
• Take profit and stop loss percentages
📈 Best Used For:
• Mean reversion setups
• Assets with cyclical or range-bound behavior
• Identifying short-term overbought/oversold conditions
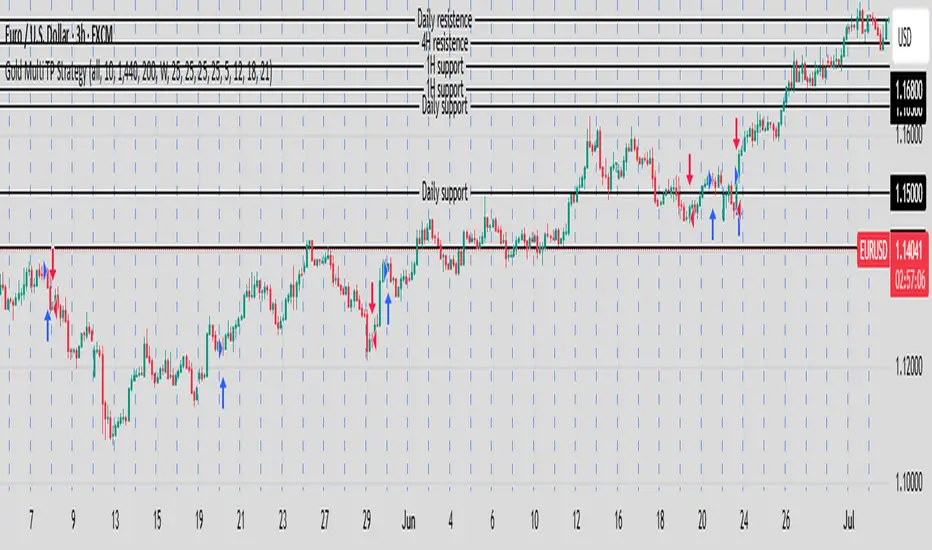
Gold Multi TP Strategy📘 Strategy Description: Gold Multi Take-Profit Strategy (XAUUSD)
This strategy is designed for Gold (XAUUSD) and works on any timeframe (recommended: 15-min or higher). It executes trades based on a simple EMA crossover logic with optional higher-timeframe and ATR-based filters to confirm trend direction and volatility.
🔑 Core Features
✅ Directional control: Trade only long, short, or both directions (Strategy Direction)
✅ Multi-level Take Profit: Scale out at up to 4 configurable profit targets
✅ Fixed Stop Loss: Set custom SL distance for risk control
✅ Position Sizing: Allocate different percentages to each TP level
✅ HTF Trend Filter (optional): Align trades with weekly candle trend
✅ ATR Filter (optional): Improve entries with volatility-based filter
⚙️ Inputs Explained
Input Name Function
Strategy Direction Choose to trade all, long, or short only
Length of Filter Length of the moving average used for HTF trend filter
Candle Time Reference candle timeframe in minutes (e.g., 1440 for daily)
Length of ATR Period for ATR calculation (volatility)
HTF Higher timeframe for filter (e.g., 1 week)
Filter Checkbox Enable/disable trend filter
Stop Loss Fixed SL distance in price units
Qty_percent1-3 % of position allocated to TP1–TP3 (rest goes to TP4)
Take profit1–4 TP levels (in price units) from entry price
🧠 Logic Overview
Entry triggered on EMA 20/50 crossover
Optional filter: entry allowed only if current price is above its HTF MA (bullish) or below (bearish)
Position is scaled out at up to 4 profit levels using different qty_percent
SL remains fixed throughout the trade
📊 Best Use
Intraday trading on XAUUSD, ideally during London/NY sessions
Trending or breakout conditions
Works best with additional confluence (price action, S/R, news)
Breackout V8 MomentumBreakout V6 Strategy with Fibonacci TPs
Description
Developed by Coton, this automated trading tool is designed to identify and capitalize on breakouts from consolidation zones, supported by momentum indicators. It leverages technical indicators to detect significant price movements and enters positions with take-profits based on Fibonacci levels and a trailing stop to protect profits. Optimized for crypto trading , it operates in Scalping (1m) or Intraday (5m) modes.
Indicators Used
Volatility Bands : Identify price compression and expansion zones to detect consolidations and breakouts.
Momentum Indicators : Measure the strength and direction of price movements to confirm breakouts.
Volume Indicators : Validate breakouts with significant increases in trading activity.
Dynamic Levels : Define entry and exit points based on adaptive calculations.
Features
Breakout Detection : Identifies exits from consolidation zones with quality filters.
Fibonacci Take-Profits : Profit targets calculated using extension levels to maximize gains.
Trailing Stop : Protects profits by dynamically adjusting the stop-loss based on volatility.
Visualization : Displays consolidation zones, entry levels, stop-losses, and take-profits on the chart.
Alerts : Notifications for confirmed and ongoing breakouts with a minimum risk/reward ratio.
Table : Shows the strategy status and estimated leverage in real-time.
Input Parameters
Trading Mode: Scalping (1m) or Intraday (5m) (default: Intraday)
Fibonacci Level for TP: 1.618 (adjustable 0.5-5.0)
Minimum RR for Alerts: 1.2 (filters alerts)
Alerts
Confirmed Breakout (validated movement with quality criteria).
Ongoing Breakout (tracked with minimum risk/reward ratio, every 5 candles).
Disclaimers
Not financial advice; test in demo mode.
Past performance is not indicative of future results.
High risk in crypto trading; use proper risk management (1-2% per trade).
Commission (0.1%) may impact results; adjust for your broker.
Contact
Coton for questions or improvements.

Enhanced Market Structure StrategyATR-Based Risk Management:
Stop Loss: 2 ATR from entry (configurable)
Take Profit: 3 ATR from entry (configurable)
Dynamic Position Sizing: Based on ATR stop distance and max risk percentage
Advanced Signal Filters:
RSI Filter:
Long trades: RSI < 70 and > 40 (avoiding overbought)
Short trades: RSI > 30 and < 60 (avoiding oversold)
Volume Filter:
Requires volume > 1.2x the 20-period moving average
Ensures institutional participation
MACD Filter (Optional):
Long: MACD line above signal line and rising
Short: MACD line below signal line and falling
EMA Trend Filter:
50-period EMA for trend confirmation
Long trades require price above rising EMA
Short trades require price below falling EMA
Higher Timeframe Filter:
Uses 4H/Daily EMA for multi-timeframe confluence
Enhanced Entry Logic:
Regular Entries: IDM + BOS + ALL filters must pass
Sweep Entries: Failed breakouts with tighter stops (1.6 ATR)
High-Probability Focus: Only trades when multiple confirmations align
Visual Improvements:
Detailed Entry Labels: Show entry, stop, target, and risk percentage
SL/TP Lines: Visual representation of risk/reward
Filter Status: Bar coloring shows when all filters align
Comprehensive Statistics: Real-time performance metrics
Key Strategy Parameters:
pinescript// Recommended Settings for Different Markets:
// Forex (4H-Daily):
// - CHoCH Period: 50-75
// - ATR SL: 2.0, ATR TP: 3.0
// - All filters enabled
// Crypto (1H-4H):
// - CHoCH Period: 30-50
// - ATR SL: 2.5, ATR TP: 4.0
// - Volume filter especially important
// Indices (4H-Daily):
// - CHoCH Period: 50-100
// - ATR SL: 1.8, ATR TP: 2.7
// - EMA and MACD filters crucial
Expected Performance Improvements:
Win Rate: 55-70% (improved filtering)
Profit Factor: 2.0-3.5+ (better risk/reward with ATR)
Reduced Drawdown: Stricter filters reduce false signals
Consistent Risk: ATR-based stops adapt to volatility
This enhanced version provides much more robust signal filtering while maintaining the core market structure edge, resulting in higher-probability trades with consistent risk management.

US Index First 30m Candle Strategy (10m Chart)Strategy Description for Publishing
Title: US Index First 30-Minute Candle Strategy (10m Chart)
Overview:
This Pine Script implements a trading strategy designed to capitalize on price movements within the first 30 minutes of the U.S. stock market opening. It is specifically tailored for use on a 15-minute chart and is optimized for trading U.S. indices during regular market hours.
Features:
Session Time Configuration: The strategy operates within the U.S. market hours, specifically from 9:30 AM to 4:00 PM (Eastern Time).
First 30-Minute Candle Aggregation: The script identifies the high and low of the first 30-minute candle, which is considered a critical time frame for market momentum.
Single Trade Per Day: To minimize risk, the strategy is designed to execute only one trade per day based on the established range of the first 30 minutes.
Dynamic Trade Conditions: Buy and sell signals are generated when the price breaks above the high or below the low of the first 30-minute candle, with defined stop-loss and take-profit levels based on a customizable risk-reward ratio.
How It Works:
Initialization:
At the start of each trading day, the script resets the high and low values for the first 30 minutes.
Range Locking: After the first 30 minutes, the high and low values are locked, allowing for trade entries based on these levels.
Trade Execution:
Long Entry: Triggered when the price moves above the locked high.
Short Entry: Triggered when the price drops below the locked low.
Risk Management: Each trade comes with a stop-loss and take-profit mechanism to manage potential losses and secure profits.
Visuals:
The script also plots the locked high and low levels on the chart, providing a visual reference for traders.
Conclusion:
This strategy leverages the volatility often seen in the first 30 minutes of trading, aiming to capture significant price movements while maintaining a disciplined trading approach. It is suitable for traders looking to implement a systematic strategy based on early market behavior.
Usage:
To use this strategy, simply add the script to your TradingView chart, set your desired parameters, and monitor for trade signals during the specified market hours. Adjust the risk-reward ratio as needed to align with your trading style.

MMTools - Backtester❖ Overview
Backtester is a script implemented as a strategy, featuring multiple conditions and tools to offer an alternative way to work with Catcher. It supports both backtesting and algorithmic trading, allowing you to evaluate the indicator's performance on historical data for any instrument using the Strategy Tester.
❖ Settings
⚙️ Custom Conditions and Signals
This section is intended to provide flexibility when working with Catcher. (If you intend to use Catcher alone, this section can be disregarded). You may combine the primary indicator (Catcher) with additional custom indicators to define entry and exit signals. Simply add the custom indicator to your chart, display it and then select its name in the corresponding dropdown menu. By default, the 'Close' option is selected, meaning custom conditions are disabled.
Operator 'OR': An entry order is activated when either your custom signal or the primary signal occurs.
Operator 'AND': An entry order is activated only when both the custom and primary signals occur simultaneously.
If both 'AND' and 'OR' operators are used, enabling the 'Only Primary' option will apply the 'AND' operator only to the primary indicator.
Custom Exit: Allows the strategy to close a position based on a custom signal, in addition to standard exit conditions. The first condition met will trigger the exit.
Note: The strategy executes orders at the open of the next bar after the custom condition is met.
⚙️ Confirmation
When enabled, the strategy will enter a position only if a specified number of signals occur within a defined lookback period.
⚙️ Exits
Two types of exit mechanisms are available for take-profit and stop-loss:
Timeout: Sets a maximum duration (in bars) that a trade can remain open. If this limit is exceeded, the strategy will close the position.
Percentage-Based: Exit positions based on a specified percentage move.
⚙️ Start Date
Specifies the starting point for the backtest.
⚙️ Plotting
The green line represents the take-profit level, while the red line indicates the stop-loss level. Plotting is limited to the last 250 bars.
⚙️ Other Settings
Remember to configure additional parameters under the “Properties” tab, including commissions, slippage, and pyramiding. Default commission is set at 0.05%.
❖ Access
Please refer to the Author's Instructions field to request access to the script.
-----------------------------------------------------------
Disclaimer
The information provided by my scripts is for informational purposes only and does not constitute financial advice. Past performance is not indicative of future results. Always do your own research before making financial decisions.

Volume and Volatility Ratio Indicator-WODI策略名称
交易量与波动率比例策略-WODI
一、用户自定义参数
vol_length:交易量均线长度,计算基础交易量活跃度。
index_short_length / index_long_length:指数短期与长期均线长度,用于捕捉中短期与中长期趋势。
index_magnification:敏感度放大倍数,调整指数均线的灵敏度。
index_threshold_magnification:阈值放大因子,用于动态过滤噪音。
lookback_bars:形态检测回溯K线根数,用于捕捉反转模式。
fib_tp_ratio / fib_sl_ratio:斐波那契止盈与止损比率,分别对应黄金分割(0.618/0.382 等)级别。
enable_reversal:反转信号开关,开启后将原有做空信号反向为做多信号,用于单边趋势加仓。
二、核心计算逻辑
交易量百分比
使用 ta.sma 计算 vol_ma,并得到 vol_percent = volume / vol_ma * 100。
价格波动率
volatility = (high – low) / close * 100。
构建复合指数
volatility_index = vol_percent * volatility,并分别计算其短期与长期均线(乘以 index_magnification)。
动态阈值
index_threshold = index_long_ma * index_threshold_magnification,过滤常规波动。
三、信号生成与策略执行
做多/做空信号
当短期指数均线自下而上突破长期均线,且 volatility_index 突破 index_threshold 时,发出做多信号。
当短期指数均线自上而下跌破长期均线,且 volatility_index 跌破 index_threshold 时,发出做空信号。
反转信号模式(可选)
若 enable_reversal = true,则所有做空信号反向为做多,用于在强趋势行情中加仓。
止盈止损管理
进场后自动设置斐波那契止盈位(基于入场价 × fib_tp_ratio)和止损位(入场价 × fib_sl_ratio)。
支持多级止盈:可依次以 0.382、0.618 等黄金分割比率分批平仓。
四、图表展示
策略信号标记:图上用箭头标明每次做多/做空(或反转加仓)信号。
斐波那契区间:在K线图中显示止盈/止损水平线。
复合指数与阈值线:与原版相同,在独立窗口绘制短、长期指数均线、指数曲线及阈值。
量能柱状:高于均线时染色,反转模式时额外高亮。
Strategy Name
Volume and Volatility Ratio Strategy – WODI
1. User-Defined Parameters
vol_length: Length for volume SMA.
index_short_length / index_long_length: Short and long MA lengths for the composite index.
index_magnification: Sensitivity multiplier for index MAs.
index_threshold_magnification: Threshold multiplier to filter noise.
lookback_bars: Number of bars to look back for pattern detection.
fib_tp_ratio / fib_sl_ratio: Fibonacci take-profit and stop-loss ratios (e.g. 0.618, 0.382).
enable_reversal: Toggle for reversal mode; flips short signals to long for trend-following add-on entries.
2. Core Calculation
Volume Percentage:
vol_ma = ta.sma(volume, vol_length)
vol_percent = volume / vol_ma * 100
Volatility:
volatility = (high – low) / close * 100
Composite Index:
volatility_index = vol_percent * volatility
Short/long MAs applied and scaled by index_magnification.
Dynamic Threshold:
index_threshold = index_long_ma * index_threshold_magnification.
3. Signal Generation & Execution
Long/Short Entries:
Long when short MA crosses above long MA and volatility_index > index_threshold.
Short when short MA crosses below long MA and volatility_index < index_threshold.
Reversal Mode (optional):
If enable_reversal is on, invert all short entries to long to scale into trending moves.
Fibonacci Take-Profit & Stop-Loss:
Automatically set TP/SL levels at entry price × respective Fibonacci ratios.
Supports multi-stage exits at 0.382, 0.618, etc.
4. Visualization
Signal Arrows: Marks every long/short or reversal-add signal on the chart.
Fibonacci Zones: Plots TP/SL lines on the price panel.
Index & Threshold: Same as v1.0, with MAs, index curve, and threshold in a separate sub-window.
Volume Bars: Colored when above vol_ma; extra highlight if a reversal-add signal triggers

Intraday Trading Hit and Run# Strategy Overview
This is a short-term trading system designed for quick entries/exits (intraday). It uses multiple technical indicators to identify momentum trades in the direction of the trend, with built-in risk management through trailing stops.
# Main Components
1. Trend Filter
Uses two EMAs (10-period "fast" blue line and 100-period "slow" red line)
Only trades when:
Long: Price AND fast EMA are above slow EMA
Short: Price AND fast EMA are below slow EMA
2. Main Signal
////Stochastic Oscillator (14-period):
Buy when %K line crosses above %D line
Sell when %K crosses below %D
////Trend Strength Check
Smoothed ADX indicator (5-period EMA of ADX):
Requires ADX value ≥ 25 to confirm strong trend
3. Confirmation using Volume Filter (Optional)
Checks if current volume is 1.5× greater than 20-period average volume
# Entry Rules
A trade is only taken when:
All 3 indicators agree (EMA trend, Stochastic momentum, ADX strength)
Volume filter is satisfied (if enabled)
# Exit Rules
1. Emergency Exit:
Close long if price drops below fast EMA
Close short if price rises above fast EMA
2. Trailing Stop:
Actively protects profits by moving stop-loss:
Maintains 0.1% distance from highest price (longs) or lowest price (shorts)
# Risk Management
Only use 10% of account per trade
Includes 0.04% commission cost in calculations
All trades monitored with trailing stops
# How It Operates
The strategy looks for strong, high-volume momentum moves in the direction of the established trend (as determined by EMAs). It jumps in quickly ("hit") when conditions align, then protects gains with an automatic trailing stop ("run"). Designed for fast markets where trends develop rapidly.
You can use it on 15m, 1h or 4h

Ai BTC Signals Buy & Whales / Liquidation - Strategy [Ai Whales]Dear Trader,
The development involved professional analysts and incorporated AI to adapt signals to the modern, constantly changing, and highly volatile BTCUSD market, also taking into account the presence and actions of large institutional players — the so-called "Whales." The strategy allows you to instantly evaluate any configuration you set within the indicator and see the results reflected in professional performance metrics aligned with your chosen strategy.
The indicator displays several signals on the chart:
1) Buy signal (not sell signals)
2) Take profit line and price
3) Stop loss line and price
4) Manipulations & Liquidations observed in the market
5) Whale activity—buying in small, medium, and large amounts
The indicator does not repaint because it is based on showing signals only after the candle closes, so the calculations are true and not distorted.
Recommended pair: BTCUSD ; BTCUSDT ; BTCUSDTP and same.
The indicator can show R/R - 0.5:1 1:1 1:2 1:3 1:4
Recommended timeframes for use: from 4 hours up to 1 week, with the ideal being 1 day. However, you are free to experiment with other near timeframes.
Possible trading modes: spot or futures.
Some methods used in the calculations of the indicator:
- statistical patterns that have the ability to repeat in the future. Bitcoin cycles in different market phases that also have the ability to repeat and are included in the indicator,
- miners' capitulation and hashrate level are also taken into account by the indicator,
- candle volumes and their deltas are taken into account in the calculations,
- as well as other bases such as RSI and its divergence, the crossing of EMA of various configurations and etc.
**How the strategy calculates positions:**
A position opens at the Buy signal level and is fixed at the level of the thick green line, which serves as the primary take profit target. Pyramiding (adding to positions) can be enabled in the settings.
The size of each position is adjustable via the settings. Importantly, each signal creates its own take profit lines. When pyramiding is enabled, all positions are eventually closed at the nearest take profit level generated by any of the pyramiding signals. This approach minimizes potential losses if the price doesn’t reach the maximum take profit levels initially set; the strategy closes positions at the closest available take profit level. This conservative method for strategy reduces risk, although ideally, each position in the pyramid should be closed at an individual take-profit level, which would lead to even better results during deep backtesting.
The strategy includes alerts that can be configured based on your platform’s capabilities. Alerts trigger on the chart when "Buy" or "Whale" signals are detected.
**Settings Overview:**
- Inside the strategy: default platform options.
- Inside the indicato have some filters:
1) allows traders to choose display modes
2) position entries based on market phase—rising or falling
3) can also select whether to trade after manipulations and liquidations
4) can also select whether to trade after whale activity (small medium or big amounts of whales).
You can manually adjust take profit and stop loss levels via simple method selections, making these flexible yet user-friendly. The indicator offers three main styles:
- "Universal" (standard levels)
- "Aggressive"
- "Conservative"
**Performance and caveats:**
Deep Backtested from day one of Bitcoin’s listing on various exchanges under specific conditions (no liquidations, certain settings), the indicator has shown a maximum drawdown of about 5-15%, with final returns surpassing "buy and hold" more than 1000000% and WinRate 93-100% However, it’s crucial to understand that such spectacular past performance does not guarantee future results.
If you are serious about your investments, remember that geopolitical events, institutional shifts, or other unforeseen factors can significantly impact Bitcoin’s price—or even its existence. Unfortunately, AI has not yet learned to fully account for these macro conditions within its adaptive mechanisms.
Trade wisely, and use this powerful tool responsibly.
Best regards,

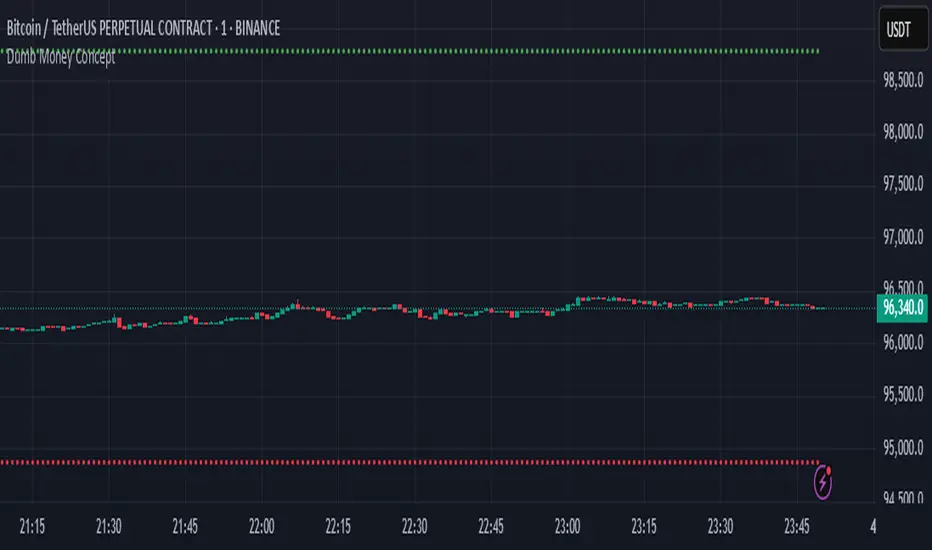
Dumb Money ConceptUse in 1 minute timeframe
1. Strategy setup
Name & sizing: Trades 25% of your account on each signal, assumes 0.04% commission + 2‑tick slippage, starts with a notional 10 million.
Timing: Only makes decisions at each 1‑minute bar close, and processes orders at bar‑close.
2. Optional filters (both default to off)
Volatility filter : when on, requires that yesterday’s ATR (average true range) ≥ your threshold before even placing an entry.
Trend filter : when on, only allows a “long” if yesterday’s close was above its daily MA, or a “short” if below.
You can toggle each filter on/off and adjust ATR period, ATR threshold, and MA length through the inputs at the top.
3. Signal logic (“dumb money” wicks)
At today’s first minute, the script pulls yesterday’s open, high, low, close, ATR and MA—using only completed daily bars so nothing repaints.
It measures the size of yesterday’s upper wick (close→high) vs. lower wick (open→low).
If the upper wick was longer, that sets a long bias (“dumb money” got shaken out at the top). Otherwise it sets a short bias.
4. Calculate where to place orders
On that same first minute of day:
Entry: a limit order at half of yesterday’s range away from today’s open (below the open for longs, above for shorts).
Stop‑loss: one full‑range (×1.0) below today’s open for longs (and above for shorts).
Take‑profit: 1.236× yesterday’s range above today’s open for longs (and below for shorts).
5. Apply filters before sending entry
Before actually placing that limit order, it checks:
Volatility: if enabled, requires yesterday’s ATR ≥ your “Min Daily ATR.”
Trend: if enabled, requires yesterday’s close to lie on the same side of its daily MA as your signal.
If either filter fails, no order is sent.
6. Give the limit order up to 24 hours to fill
The code remembers the bar‑index when the order went live.
If 1440 one‑minute bars pass (≈24 h) without a fill, it automatically cancels the unfilled entry—so stale orders don’t hang around.
7. Once filled, TP/SL manage the trade
As soon as your limit order executes, two opposite orders are placed:
A take‑profit at the 1.236× range level
A stop‑loss at the –1.0× range level
One cancels the other when triggered.
8. No overnight risk
On the very first minute of the next daily bar, any position still open is force‑closed (“Time Exit”)
Fibonacci + TP/SL Strategy [Backtest]✅ Key Features Added and Adjusted:
Fibonacci Retracement Levels:
Automatically calculated based on the last 100 bars' high/low
Plotted levels: 0%, 23.6%, 38.2%, 50%, 61.8%, 78.6%, 100%
Extension targets: 161.8%, 261.8%, 423.6%
Buy/Sell Signal Logic:
Buy: Price is between 78.6% and 38.2% levels
Sell: Price is between 61.8% and 23.6% levels
Both depend on a can_trade time filter to avoid overtrading
ATR-based Stop-Loss:
Stop-loss dynamically adapts to market volatility:
SL = Entry - ATR * 1.5 (long)
SL = Entry + ATR * 1.5 (short)
Fixed Take-Profit:
Configurable via input: default is 4%
Can be changed in TradingView UI
Golden/Death Cross Indicator (Visual Only):
EMA 50 crossing EMA 200 plotted on chart:
Golden Cross = Buy signal (green triangle)
Death Cross = Sell signal (red triangle)
Weekly Profit Cap:
Prevents new trades if weekly profit exceeds 15%
Resets at the start of every week
Visual Elements:
All Fibonacci levels are plotted
Buy/Sell signals are labeled on the chart (BUY, SELL)

PowerHouse SwiftEdge AI v2.10 StrategyOverview
The PowerHouse SwiftEdge AI v2.10 Strategy is a sophisticated trading system designed to identify high-probability trade setups in forex, stocks, and cryptocurrencies. By combining multi-timeframe trend analysis, momentum signals, volume confirmation, and smart money concepts (Change of Character and Break of Structure ), this strategy offers traders a robust tool to capitalize on market trends while minimizing false signals. The strategy’s unique “AI” component analyzes trends across multiple timeframes to provide a clear, actionable dashboard, making it accessible for both novice and experienced traders. The strategy is fully customizable, allowing users to tailor its filters to their trading style.
What It Does
This strategy generates Buy and Sell signals based on a confluence of technical indicators and smart money concepts. It uses:
Multi-Timeframe Trend Analysis: Confirms the market’s direction by analyzing trends on the 1-hour (60M), 4-hour (240M), and daily (D) timeframes.
Momentum Filter: Ensures trades align with strong price movements to avoid choppy markets.
Volume Filter: Validates signals with above-average volume to confirm market participation.
Breakout Filter: Requires price to break key levels for added confirmation.
Smart Money Signals (CHoCH/BOS): Identifies reversals (CHoCH) and trend continuations (BOS) based on pivot points.
AI Trend Dashboard: Summarizes trend strength, confidence, and predictions across timeframes, helping traders make informed decisions without needing to analyze complex data manually.
The strategy also plots dynamic support and resistance trendlines, take-profit (TP) levels, and “Get Ready” signals to alert users of potential setups before they fully develop. Trades are executed with predefined take-profit and stop-loss levels for disciplined risk management.
How It Works
The strategy integrates multiple components to create a cohesive trading system:
Multi-Timeframe Trend Analysis:
The strategy evaluates trends on three timeframes (1H, 4H, Daily) using Exponential Moving Averages (EMA) and Volume-Weighted Average Price (VWAP). A trend is considered bullish if the price is above both the EMA and VWAP, bearish if below, or neutral otherwise.
Signals are only generated when the trend on the user-selected higher timeframe aligns with the trade direction (e.g., Buy signals require a bullish higher timeframe trend). This reduces noise and ensures trades follow the broader market context.
Momentum Filter:
Measures the percentage price change between consecutive bars and compares it to a volatility-adjusted threshold (based on the Average True Range ). This ensures trades are taken only during significant price movements, filtering out low-momentum conditions.
Volume Filter (Optional):
Checks if the current volume exceeds a long-term average and shows positive short-term volume change. This confirms strong market participation, reducing the risk of false breakouts.
Breakout Filter (Optional):
Requires the price to break above (for Buy) or below (for Sell) recent highs/lows, ensuring the signal aligns with a structural shift in the market.
Smart Money Concepts (CHoCH/BOS):
Change of Character (CHoCH): Detects potential reversals when the price crosses under a recent pivot high (for Sell) or over a recent pivot low (for Buy) with a bearish or bullish candle, respectively.
Break of Structure (BOS): Confirms trend continuations when the price breaks below a recent pivot low (for Sell) or above a recent pivot high (for Buy) with strong momentum.
These signals are plotted as horizontal lines with labels, making it easy to visualize key levels.
AI Trend Dashboard:
Combines trend direction, momentum, and volatility (ATR) across timeframes to calculate a trend score. Scores above 0.5 indicate an “Up” trend, below -0.5 indicate a “Down” trend, and otherwise “Neutral.”
Displays a table summarizing trend strength (as a percentage), AI confidence (based on trend alignment), and Cumulative Volume Delta (CVD) for market context.
A second table (optional) shows trend predictions for 1H, 4H, and Daily timeframes, helping traders anticipate future market direction.
Dynamic Trendlines:
Plots support and resistance lines based on recent swing lows and highs within user-defined periods (shortTrendPeriod, longTrendPeriod). These lines adapt to market conditions and are colored based on trend strength.
Why This Combination?
The PowerHouse SwiftEdge AI v2.10 Strategy is original because it seamlessly integrates traditional technical analysis (EMA, VWAP, ATR, volume) with smart money concepts (CHoCH, BOS) and a proprietary AI-driven trend analysis. Unlike standalone indicators, this strategy:
Reduces False Signals: By requiring confluence across trend, momentum, volume, and breakout filters, it minimizes trades in choppy or low-conviction markets.
Adapts to Market Context: The ATR-based momentum threshold adjusts dynamically to volatility, ensuring signals remain relevant in both trending and ranging markets.
Simplifies Decision-Making: The AI dashboard distills complex multi-timeframe data into a user-friendly table, eliminating the need for manual analysis.
Leverages Smart Money: CHoCH and BOS signals capture institutional price action patterns, giving traders an edge in identifying reversals and continuations.
The combination of these components creates a balanced system that aligns short-term trade entries with longer-term market trends, offering a unique blend of precision, adaptability, and clarity.
How to Use
Add to Chart:
Apply the strategy to your TradingView chart on a liquid symbol (e.g., EURUSD, BTCUSD, AAPL) with a timeframe of 60 minutes or lower (e.g., 15M, 60M).
Configure Inputs:
Pivot Length: Adjust the number of bars (default: 5) to detect pivot highs/lows for CHoCH/BOS signals. Higher values reduce noise but may delay signals.
Momentum Threshold: Set the base percentage (default: 0.01%) for momentum confirmation. Increase for stricter signals.
Take Profit/Stop Loss: Define TP and SL in points (default: 10 each) for risk management.
Higher/Lower Timeframe: Choose timeframes (60M, 240M, D) for trend filtering. Ensure the chart timeframe is lower than or equal to the higher timeframe.
Filters: Enable/disable momentum, volume, or breakout filters to suit your trading style.
Trend Periods: Set shortTrendPeriod (default: 30) and longTrendPeriod (default: 100) for trendline plotting. Keep below 2000 to avoid buffer errors.
AI Dashboard: Toggle Enable AI Market Analysis to show/hide the prediction table and adjust its position.
Interpret Signals:
Buy/Sell Labels: Green "Buy" or red "Sell" labels indicate trade entries with predefined TP/SL levels plotted.
Get Ready Signals: Yellow "Get Ready BUY" or orange "Get Ready SELL" labels warn of potential setups.
CHoCH/BOS Lines: Aqua (CHoCH Sell), lime (CHoCH Buy), fuchsia (BOS Sell), or teal (BOS Buy) lines mark key levels.
Trendlines: Green/lime (support) or fuchsia/purple (resistance) dashed lines show dynamic support/resistance.
AI Dashboard: Check the top-right table for trend strength, confidence, and CVD. The optional bottom table shows trend predictions (Up, Down, Neutral).
Backtest and Trade:
Use TradingView’s Strategy Tester to evaluate performance. Adjust TP/SL and filters based on results.
Trade manually based on signals or automate with TradingView alerts (set alerts for Buy/Sell labels).
Originality and Value
The PowerHouse SwiftEdge AI v2.10 Strategy stands out by combining multi-timeframe analysis, smart money concepts, and an AI-driven dashboard into a single, user-friendly system. Its adaptive momentum threshold, robust filtering, and clear visualizations empower traders to make confident decisions without needing advanced technical knowledge. Whether you’re a day trader or swing trader, this strategy provides a versatile, data-driven approach to navigating dynamic markets.
Important Notes:
Risk Management: Always use appropriate position sizing and risk management, as the strategy’s TP/SL levels are customizable.
Symbol Compatibility: Test on liquid symbols with sufficient historical data (at least 2000 bars) to avoid buffer errors.
Performance: Backtest thoroughly to optimize settings for your market and timeframe.

Rawstocks 15 Minute ModelRawstocks 15-Minute Model
The Rawstocks 15-Minute Model is a precision intraday trading strategy designed for the US stock market (9:30 AM - 4:00 PM ET), optimized for the 15-minute timeframe. It combines institutional order flow concepts with Fibonacci retracements to identify high-probability reversal setups while enforcing strict risk management and session-based rules.
Key Features
Time-Based Execution
Trading Hours: 9:30 AM - 4:00 PM ET (no new entries after 4:00 PM)
Force Close: All positions auto-exit at 4:30 PM ET (prevents overnight risk)
Entry Logic
Order Block + Fib Confluence:
Identifies institutional order blocks (previous swing highs/lows)
Requires price pullback to 61.8% or 79% Fibonacci level
Liquidity Confirmation:
Waits for stop runs (liquidity sweeps) before reversal entries
Exit Rules
Stop Loss: 1x ATR (14) from entry
Take Profit: 2:1 Risk-Reward (adjustable)
Visual Signals
Green Triangle: Valid long setup (pullback to bullish OB + Fib)
Red Triangle: Valid short setup (pullback to bearish OB + Fib)
Blue/Purple Background: Highlights active trading vs. close period
How It Works
Identify the Setup
Wait for a strong impulse move (break of structure)
Mark the order block (institutional zone)
Confirm Pullback
Price must retrace to 61.8% or 79% Fib level
Must occur within trading hours (9:30 AM - 4:00 PM)
Enter on Confirmation
Long: Break of pullback candle high (stop below recent swing low)
Short: Break of pullback candle low (stop above recent swing high)
Manage the Trade
Trail stop or exit at 2R (risk-to-reward)
All positions close at 4:30 PM sharp

Cyclical CALL/PUT StrategyThis script identifies optimal CALL (long) and PUT (short) entries using a cyclical price wave modeled from a sine function and confirmed with trend direction via a 200 EMA.
Strategy Highlights:
Cycle-Based Signal: Detects market rhythm with a smoothed sinusoidal wave.
Trend Confirmation: Filters entries using a customizable EMA (default: 200).
Auto-Scaling: Wave height adjusts dynamically to price action volatility.
Risk Parameters:
Take Profit: Default 5% (customizable)
Stop Loss: Default 2% (customizable)
Signal Triggers:
CALL Entry: Price crosses above the scaled wave and in an uptrend
PUT Entry: Price crosses below the scaled wave and in a downtrend
Inputs:
Cycle Length
Smoothing
Wave Height
EMA Trend Length
Take Profit %
Stop Loss %
Visuals:
Gray line = Scaled Cycle Wave
Orange line = 200 EMA Trend Filter
Best For: Traders looking to make 1–2 high-probability trades per week on SPY or other highly liquid assets.
Timeframes: Works well on 2-min, 15-min, and daily charts.

TrendTwisterV1.5 (Forex Ready + Indicators)A Precision Trend-Following TradingView Strategy for Forex**
HullShiftFX is a Pine Script strategy for TradingView that combines the power of the **Hull Moving Average (HMA)** and a **shifted Exponential Moving Average (EMA)** with multi-layered momentum filters including **RSI** and **dual Stochastic Oscillators**.
It’s designed for traders looking to catch high-probability breakouts with tight risk management and visual clarity.
Chart settings:
1. Select "Auto - Fits data to screen"
2. Please Select "Scale Price Chart Only" (To make the chart not squished)
### ✅ Entry Conditions
**Long Position:**
- Price closes above the 12-period Hull Moving Average.
- Price closes above the 5-period EMA shifted forward by 2 bars.
- RSI is above 50.
- Stochastic Oscillator (12,3,3) %K is above 50.
- Stochastic Oscillator (5,3,3) %K is above 50.
- Hull MA crosses above the shifted EMA.
**Short Position:**
- Price closes below the 12-period Hull Moving Average.
- Price closes below the 5-period EMA shifted forward by 2 bars.
- RSI is below 50.
- Stochastic Oscillator (12,3,3) %K is below 50.
- Stochastic Oscillator (5,3,3) %K is below 50.
- Hull MA crosses below the shifted EMA.
---
## 📉 Risk Management
- **Stop Loss:** Set at the low (for long) or high (for short) of the previous 2 candles.
- **Take Profit:** Calculated at a risk/reward ratio of **1.65x** the stop loss distance.
---
## 📊 Indicators Used
- **Hull Moving Average (12)**
- **Exponential Moving Average (5) **
- **Relative Strength Index (14)**
- **Stochastic Oscillators:**
- %K (12,3,3)
- %K (5,3,3)

NY First Candle Break and RetestStrategy Overview
Session and Time Parameters:
The strategy focuses on the New York trading session, starting at 9:30 AM and lasting for a predefined session length, typically 3 to 4 hours. This timing captures the most active market hours, providing ample trading opportunities.
Strategy Parameters:
Utilizes the Average True Range (ATR) to set dynamic stop-loss levels, ensuring risk is managed according to market volatility.
Employs a reward-to-risk ratio to determine take profit levels, aiming for a balanced approach between potential gains and losses.
Strategy Settings:
Incorporates simple moving averages (EMA) and the Volume Weighted Average Price (VWAP) to identify trend direction and price levels.
Volume confirmation is used to validate breakouts, ensuring trades are based on significant market activity.
Trade Management:
Features a trailing stop mechanism to lock in profits as the trade moves in favor, with multiple take profit levels to secure gains incrementally.
The strategy is designed to handle both long and short positions, adapting to market conditions.
Alert Settings:
Provides alerts for key events such as session start, breakout, retest, and entry signals, helping traders stay informed and act promptly.
Visual cues on the chart highlight entry and exit points, making it easier for beginners to follow the strategy.
This strategy is particularly suited for the current volatile market environment, where simplicity and clear guidelines can help beginner traders navigate the complexities of trading. It emphasizes risk management and uses straightforward indicators to make informed trading decisions.
I put together this Trading View scalping strategy for futures markets with some help from Claude AI. Shoutout to everyone who gave me advice along the way—I really appreciate it! I’m sure there’s room for improvement, so feel free to share your thoughts… just go easy on me. :)

Scalping 15min: EMA + MACD + RSI + ATR-based SL/TP📈 Strategy: 15-Minute Scalping — EMA + MACD + RSI + ATR-based SL/TP
This scalping strategy is designed for 15-minute charts and combines trend-following and momentum confirmation with dynamic stop loss and take profit levels based on volatility.
🔧 Indicators Used:
EMA 50 — identifies the main trend
MACD Histogram — confirms momentum direction
RSI (14) — filters overbought/oversold conditions
ATR (14) — dynamically sets SL and TP based on market volatility
📊 Entry Conditions:
Long Entry:
Price is above EMA 50
MACD histogram is positive
RSI is above 50 but below 70
Short Entry:
Price is below EMA 50
MACD histogram is negative
RSI is below 50 but above 30
🛑 Risk Management:
Stop Loss: 1×ATR (user-configurable)
Take Profit: 2×ATR (user-configurable)
These values can be adjusted in the script inputs depending on your risk/reward preference or market conditions.
⚠️ Notes:
Strategy is optimized for scalping fast-moving pairs (e.g. crypto, forex).
Works best in trending markets.
Use backtesting and forward testing before live trading.

Smart Grid Scalping (Pullback) Strategy[BullByte]The Smart Grid Scalping (Pullback) Strategy is a high-frequency trading strategy designed for short-term traders who seek to capitalize on market pullbacks. This strategy utilizes a dynamic ATR-based grid system to define optimal entry points, ensuring precise trade execution. It integrates volatility filtering and an RSI-based confirmation mechanism to enhance signal accuracy and reduce false entries.
This strategy is specifically optimized for scalping by dynamically adjusting trade levels based on current market conditions. The grid-based system helps capture retracement opportunities while maintaining strict trade management through predefined profit targets and trailing stop-loss mechanisms.
Key Features :
1. ATR-Based Grid System :
- Uses a 10-period ATR to dynamically calculate grid levels for entry points.
- Prevents chasing trades by ensuring price has reached key levels before executing entries.
2. No Trade Zone Protection :
- Avoids low-volatility zones where price action is indecisive.
- Ensures only high-momentum trades are executed to improve success rate.
3. RSI-Based Entry Confirmation :
- Long trades are triggered when RSI is below 30 (oversold) and price is in the lower grid zone.
- Short trades are triggered when RSI is above 70 (overbought) and price is in the upper grid zone.
4. Automated Trade Execution :
- Long Entry: Triggered when price drops below the first grid level with sufficient volatility.
- Short Entry: Triggered when price exceeds the highest grid level with sufficient volatility.
5. Take Profit & Trailing Stop :
- Profit target set at a customizable percentage (default 0.2%).
- Adaptive trailing stop mechanism using ATR to lock in profits while minimizing premature exits.
6. Visual Trade Annotations :
- Clearly labeled "LONG" and "SHORT" markers appear at trade entries for better visualization.
- Grid levels are plotted dynamically to aid decision-making.
Strategy Logic :
- The script first calculates the ATR-based grid levels and ensures price action has sufficient volatility before allowing trades.
- An additional RSI filter is used to ensure trades are taken at ideal market conditions.
- Once a trade is executed, the script implements a trailing stop and predefined take profit to maximize gains while reducing risks.
---
Disclaimer :
Risk Warning :
This strategy is provided for educational and informational purposes only. Trading involves significant risk, and past performance is not indicative of future results. Users are advised to conduct their own due diligence and risk management before using this strategy in live trading.
The developer and publisher of this script are not responsible for any financial losses incurred by the use of this strategy. Market conditions, slippage, and execution quality can affect real-world trading outcomes.
Use this script at your own discretion and always trade responsibly.

PVSRA v5Overview of the PVSRA Strategy
This strategy is designed to detect and capitalize on volume-driven threshold breaches in price candles. It operates on the premise that when a high-volume candle breaks a critical price threshold, not all orders are filled within that candle’s range. This creates an imbalance—similar to a physical system being perturbed—causing the price to revert toward the level where the breach occurred to “absorb” the residual orders.
Key Features and Their Theoretical Underpinnings
Dynamic Volume Analysis and Threshold Detection
Volume Surges as Market Perturbations:
The script computes a moving average of volume over a short window and flags moments when the current volume significantly exceeds this average. These surges act as a perturbation—injecting “energy” into the market.
Adaptive Abnormal Volume Threshold:
By calculating a dynamic abnormal threshold using a daily volume average (via an 89-period VWMA) and standard deviation, the strategy identifies when the current volume is abnormally high. This mechanism mirrors the idea that when a system is disturbed (here, by a volume surge), it naturally seeks to return to equilibrium.
Candle Coloring and Visual Signal Identification
Differentiation of Candle Types:
The script distinguishes between bullish (green) and bearish (red) candles. It applies different colors based on the strength of the volume signal, providing a clear, visual representation of whether a candle is likely to trigger a price reversion.
Implication of Unfilled Orders:
A red (bearish) candle with high volume implies that sell pressure has pushed the price past a critical threshold—yet not all buy orders have been fulfilled. Conversely, a green (bullish) candle indicates that aggressive buying has left pending sell orders. In both cases, the market is expected to reverse toward the breach point to restore balance.
Trade Execution Logic: Normal and Reversal Trades
Normal Trades:
When a high-volume candle breaches a threshold and meets the directional conditions (e.g., a red candle paired with price above a daily upper band), the strategy enters a trade anticipating a reversion. The underlying idea is that the market will move back to the level where the threshold was crossed—clearing the residual orders in a manner analogous to a system following the path of least resistance.
Reversal Trades:
The strategy also monitors for clusters of consecutive signals within a short lookback period. When multiple signals accumulate, it interprets this as the market having overextended and, in a corrective move, reverses the typical trade direction. This inversion captures the market’s natural tendency to “correct” itself by moving in discrete, quantized steps—each step representing the absorption of a minimum quantum of order imbalance.
Risk and Trade Management
Stop Loss and Take Profit Buffers:
Both normal and reversal trades include predetermined buffers for stop loss and take profit levels. This systematic risk management approach is designed to capture the anticipated reversion while minimizing potential losses, aligning with the idea that market corrections follow the most energy-efficient path back to equilibrium.
Symbol Flexibility:
An option to override the chart’s symbol allows the strategy to be applied consistently across different markets, ensuring that the volume and price dynamics are analyzed uniformly.
Conceptual Bridge: From Market Dynamics to Trade Execution
At its core, the strategy treats market price movements much like a physical system that seeks to minimize “transactional energy” or inefficiency. When a price candle breaches a key threshold on high volume, it mimics an injection of energy into the system. The subsequent price reversion is the market’s natural response—moving in the most efficient path back to balance. This perspective is akin to the principle of least action, where the system evolves along the trajectory that minimizes cumulative imbalance, and it acknowledges that these corrections occur in discrete steps reflective of quantized order execution.
This unified framework allows the PVSRA strategy to not only identify when significant volume-based threshold breaches occur but also to systematically execute trades that benefit from the expected corrective moves.

NSE Index Strategy with Entry/Exit MarkersExplanation of the Code
Trend Filter (200 SMA):
The line trendSMA = ta.sma(close, smaPeriod) calculates the 200‑period simple moving average. By trading only when the current price is above this SMA (inUptrend = close > trendSMA), we aim to trade in the direction of the dominant trend.
RSI Entry Signal:
The RSI is calculated with rsiValue = ta.rsi(close, rsiPeriod). The script checks for an RSI crossover above the oversold threshold using ta.crossover(rsiValue, rsiOversold). This helps capture a potential reversal from a minor pullback in an uptrend.
ATR-Based Exits:
ATR is computed by atrValue = ta.atr(atrPeriod) and is used to set the stop loss and take profit levels:
Stop Loss: stopLossPrice = close - atrMultiplier * atrValue
Take Profit: takeProfitPrice = close + atrMultiplier * atrValue
This dynamic approach allows the exit levels to adjust according to the current market volatility.
Risk and Money Management:
The strategy uses a fixed percentage of equity (10% by default) for each trade. The built‑in commission parameter helps simulate real-world trading costs.

Simple Time-Based Strategy(Price Action Hypothesis)Core Theory: Trend Continuation Pattern Recognition**
1. **Price Action Hypothesis**
The strategy is built on the assumption that consecutive price movements (3-bar patterns) indicate momentum continuation:
- *Long Pattern*: Three consecutive higher closes combined with ascending highs
- *Short Pattern*: Three consecutive lower closes combined with descending lows
This reflects a belief that sustained directional price movement creates self-reinforcing trends that can be captured through simple pattern recognition.
2. **Time-Based Risk Management**
Implements a dynamic exit mechanism:
- *Training Phase*: 5-bar holding period (quick turnover)
- *Testing Phase*: 10-bar holding period (extended exposure)
This dual timeframe approach suggests the hypothesis that market conditions may require different holding durations in different market eras.
3. **Adaptive Market Hypothesis**
The structure incorporates two distinct phases:
- *Training Period (11 years)*: Pattern recognition without stop losses
- *Testing Period*: Pattern recognition with stop losses
This assumes markets may change character over time, requiring different risk parameters in different epochs.
4. **Asymmetric Risk Control**
Implements stop-losses only in the testing phase:
- Fixed 500-pip (point) stop distance
- Activated post-training period
This reflects a belief that historical patterns might need different risk constraints than real-time trading.
5. **Dual-Path Validation**
The split between training/testing phases suggests:
- Pattern validity should first be confirmed without protective stops
- Real-world implementation requires added risk constraints
6. **Market Efficiency Paradox**
The simultaneous use of both long/short entries assumes:
- Markets exhibit persistent inefficiencies
- These inefficiencies manifest differently in bullish/bearish conditions
- A symmetric approach can capture opportunities in both directions
7. **Behavioral Finance Elements**
The 3-bar pattern recognition potentially exploits:
- Herd mentality in trend formation
- Delayed reaction to price momentum
- Cognitive bias in trend confirmation
8. **Quantitative Time Segmentation**
The annual-based period division (training vs testing) implies:
- Market cycles operate on multi-year timeframes
- Strategy robustness requires validation across different market regimes
- Parameter sensitivity needs temporal validation
This strategy combines elements of technical pattern recognition, temporal adaptability, and phased risk management to create a systematic approach to trend exploitation. The theoretical framework suggests markets exhibit persistent but evolving patterns that can be systematically captured through rule-based execution.
